What is Profitability Ratios?
Profitability ratios helps in determining and evaluating the ability of the company to generate the income against the expenses in incurs and takes into account the different elements of Balance Sheet and Profit and loss account of the company for analyzing the performance of the company.
List of Profitability Ratios Formulas
There are different types of profitability ratios that are being used by companies in order to track their operating performance. However, in this article, we will be discussing those which are based on margin. Three major ratios in this list are gross profit margin, net profit margin, and EBITDA margin, which we will be covered here.
#1 – Gross Profit Margin Ratio
The gross profit is calculated by deducting all the direct expenses called cost of goods sold from the sales revenue. The cost of goods sold primarily includes the cost of raw material and the labor expense incurred towards the production. Finally, the gross profit margin is calculated by dividing the gross profit by the sales revenue and is expressed in terms of percentage.
Below is the formula to calculate this Profitability Ratio.
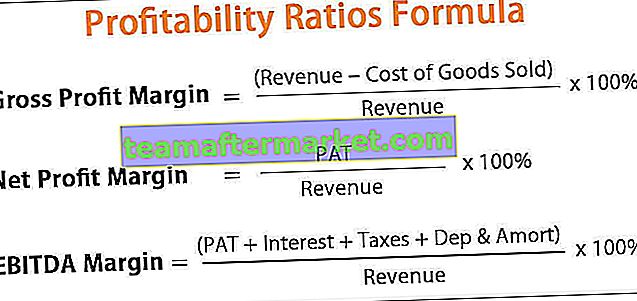
Gross Profit Margin = (Revenue – Cost of Goods Sold) / Revenue*100%#2 – Net Profit Margin Ratio
The net profit, which is also called profit after tax (PAT), is calculated by deducting all the direct and indirect expenses from the sales revenue. Then, the net profit margin is calculated by dividing the net profit by the sales revenue and is expressed in terms of percentage.
Below is the formula to calculate this Profitability Ratio
Net Profit Margin = PAT / Revenue * 100%#3 – EBITDA Margin Ratio
The EBITDA is calculated by adding back interest expense, taxes, depreciation & amortization expense to net profit or PAT. Then, the EBITDA margin is calculated by dividing the EBITDA by the sales revenue and is expressed in terms of percentage.
Explanation of the Profitability Ratios Analysis
#1 – How to Calculate Gross Profit Margin?
The formula for gross profit margin can be calculated by using the following steps:
- Step #1: Firstly, the sales revenue is taken from the profit and loss account.
- Step #2: Then, the cost of goods sold is calculated, which is the summation of raw material consumed, labor expense, and other similar direct expense attributable to the manufacturing of the product. All the information is easily available from the profit and loss account.
- Cost of Goods Sold = Raw Material Cost + Labor Expense + Other Direct Expense
- Step #3: Now, the gross profit is calculated by deducting the cost of goods sold from the sales revenue.
- Step #4: Finally, the gross profit margin is calculated by dividing the gross profit by the sales revenue and multiplied by 100%.
- Gross Profit Margin = (Revenue – Cost of Goods Sold) / Revenue * 100%
#2 – How to Calculate Net Profit Margin?
The formula for Net Profit Margin can be calculated by using the following steps:
- Step #1: Firstly, the sales revenue is calculated as described above.
- Step #2: Then, the net profit (PAT) is captured, which is categorically mentioned as a separate line item in the profit and loss account.
- Step #3: Finally, the net profit margin is calculated by dividing the net profit (PAT) by the sales revenue and multiplied by 100%.
- Net Profit Margin = PAT / Revenue * 100%
#3 – How to Calculate EBITDA Margin?
EBITDA Margin formula is given below. It can be calculated by using the following steps:
- Step #1: Firstly, the sales revenue is calculated as described above.
- Step #2: Now, interest expense, depreciation & amortization expense, and taxes paid are taken from the profit and loss account.
- Step #3: Then, EBITDA is calculated by adding back interest expense, depreciation & amortization expense, and taxes paid to PAT.
- EBITDA = PAT + Interest + Taxes + Dep & Amort
- Step #4: Finally, the EBITDA margin is calculated by dividing the EBITDA by the sales revenue and multiplied by 100%.
- EBITDA Margin = EBITDA / Revenue * 100%
Calculation Examples of Profitability Ratios Analysis
Below we have taken some practical examples to understand this concept.
You can download this Profitability Ratios Formula Excel Template here – Profitability Ratios Formula Excel Template
Let us consider an example to calculate the profitability ratios for a company called XYZ Limited. XYZ Limited is in the business of manufacturing customized roller skates for both professional and amateur skaters. At the end of the financial year, XYZ Limited has earned $150,000 in total net sales along with the following expenses.
In the below template is the data for the calculation-

From the given information,
#1 – Gross profit
= Net sales – Cost of goods sold

So form the above calculation, gross profit will be:

#2 – Net profit = $31,000

#3 – EBITDA
= Net profit + Interest expense + Tax + Depreciation expense

So from the above calculation, EBITDA will be:

Now, the Profitability Ratios,
- Gross profit margin
- = Gross profit / Net sales * 100
=53.33%

- Net Profit margin,
- = Net profit / Net sales*100%
=20.67%

- EBITDA margin
- = EBITDA / Net sales*100%
=46.67%

Rentabilitätskennzahlenanalyse in Excel
Nehmen wir nun das Beispiel aus der Praxis von Apple Inc., um die verschiedenen Rentabilitätskennzahlen in der folgenden Excel-Vorlage zu veranschaulichen. Die Tabelle enthält die detaillierte Berechnung unter Verwendung verschiedener Rentabilitätskennzahlenformeln

Wir beachten Folgendes zu den Rentabilitätskennzahlen von Apple
- Die Nettogewinnmarge ist von 21,19% im Jahr 2016 auf 22,41% im Jahr 2018 gestiegen
- Die Bruttogewinnmarge ist dagegen von 39,08% auf 38,34% gesunken.
- Ebenso ist die EBITDA-Marge von 34,01% auf 32,77% gesunken.
Relevanz und Verwendung
- Rentabilitätskennzahlen werden im Wesentlichen verwendet, um die Leistung eines Unternehmens zu bewerten. Dies wird durch Berechnung der Rentabilität auf verschiedenen Ebenen gemessen, dh Brutto, PAT und EBITDA.
- Diese Kennzahlen geben den Prozentsatz des Umsatzes an, der auf verschiedenen Ebenen vom Betriebsaufwand absorbiert wird. Je niedriger die Betriebskostenquote ist, desto höher ist die Rentabilität, was auf eine bessere Leistung hinweist.
- Die Rentabilitätsquote bleibt jedoch begrenzt, da sie nur beim Vergleich von Unternehmen derselben Branche sinnvoll ist.